

Laboratory 8:
Asian, Black and "Other" Population Distributed by County
The objective of this Laboratory was to create choropleth maps that show the county level race data ranked by percent obtained from US and created maps for “Black, Asian and another Race alone” people, in continental USA. The date were downloaded from U.S. census website and calculated the percentage of the total county population for above groups. With ArcGIS I created 3 colored maps. In these maps, the darkest color is related to the maximum population for a given group. The lightest colour is for less population density. The break points are included in given legends.
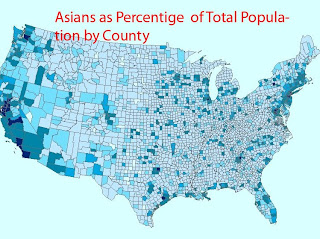
According to the data obtained from Census USA only few counties had less than 30% Asian. In the 48 states, the largest concentration of Asians is in California, in greater Los Angeles. Generally, a very little Asian representation in large states like Texas, Atlanta and New York City.
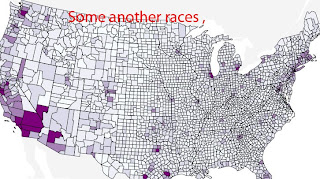
A second map is about distribution of Some other race alone. Because I got a problems with converting .xls to data base file this maps is from Census site. It can be seen that “Some other race” density is distributed close to Southwest and west coast because probably many Spanish speaking people from arrive in the USA. The same population is also in the cities like New York, Boston and Miami.
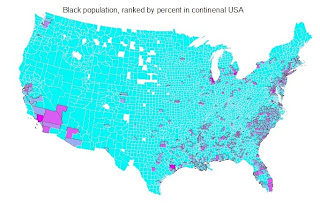
Black distribution is high in Southeast USA. I do not know the reason, but probably it is related to agricultural production over there where is more easily to find a job. The better job is also the reason for such big population in black people in areas as Los Angeles, NY and Micvhigan where auto production is well developed.
My experience using ArcGIS was encouraging. A ArcGIS is very useful , but not easy for me , a man never study geography before in his life and working in totally different area of study- material science and engineering. I got a lot of experience, even working slow, with Arc GIS and it made me more self-confident about data acquisition and processing them in ArcGIS software.